There’s something that has always annoyed me in Venn Diagrams. The two circles in a Venn Diagram will almost always be the same size, but I have no idea if the area that is often designated “both” is proportionally represented. If anything, it looks like that area is not large enough. I want to find how I can make that area 1/3 of the whole graph.

Finding the area of that section is not going to be simple because the section is made by two different curves (I know that the area should be 1/2 of the circle’s area because of equality, but actually evaluating the area will be more complicated). If the centers of the two circles are 2r (r is the radius) apart, then the area is 0. If the two circles are marginally close together, then the area will be very close to pi r squared. Whatever formula I derive, the possible values should fall within this range.
If I make the distance greater than 2r, then the values should be imaginary. It’s the only output that would make sense when you cannot even see the section being described.
I am looking for the ratio between the radius and the distance from the centers that will make the area of the section 1/3 of the total area, or 1/2 of a circle. The circle equation is shown below. I can solve for y and have y= square root (1-x^2) if the radius is 1 and the center is at the origin.
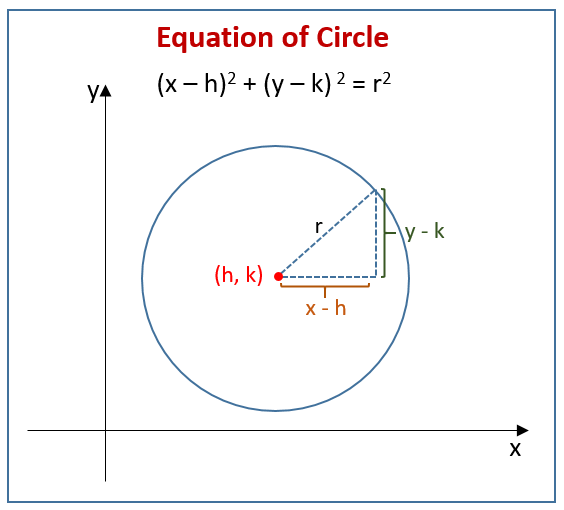
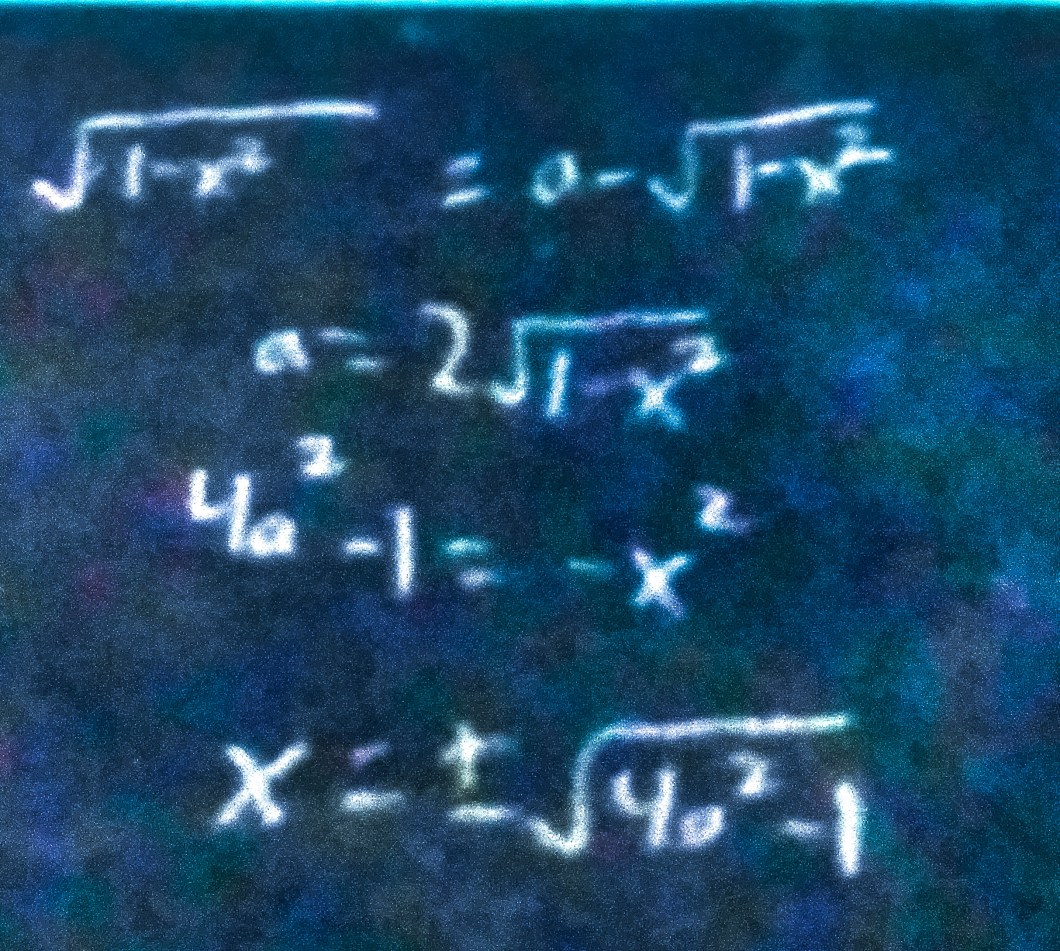
I do not know what the vertical shift is, so I will make the second equation y= -square root (1-x^2) + a. I am solving for a. I will integrate the equations and set them equal to pi.
But there’s another problem. I don’t know what my limits are on the integral, and they change depending on what a is. These are what the limits should be.
Now, I evaluate the integral.
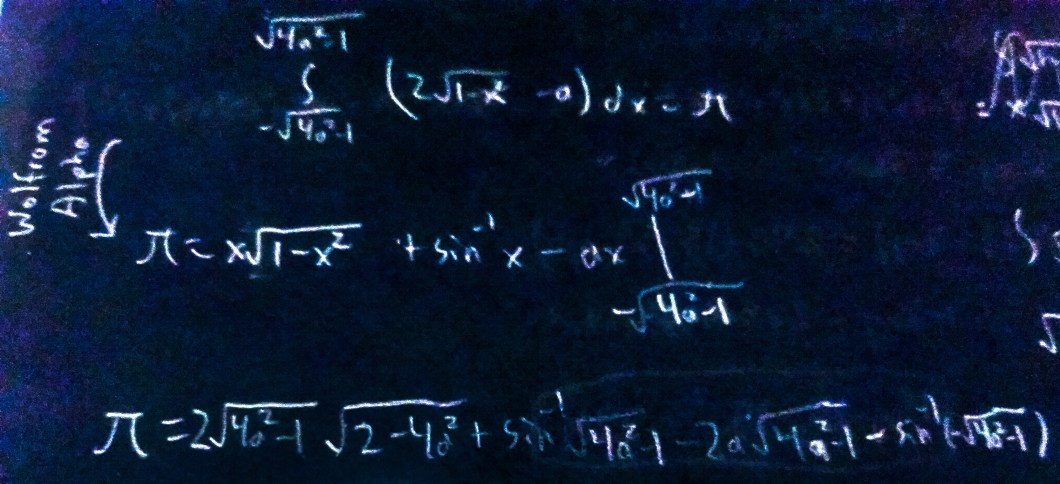
I used Wolfram Alpha to evaluate a tricky part because it involves u substitution of sines and cosines, and I do not want to deal with that.
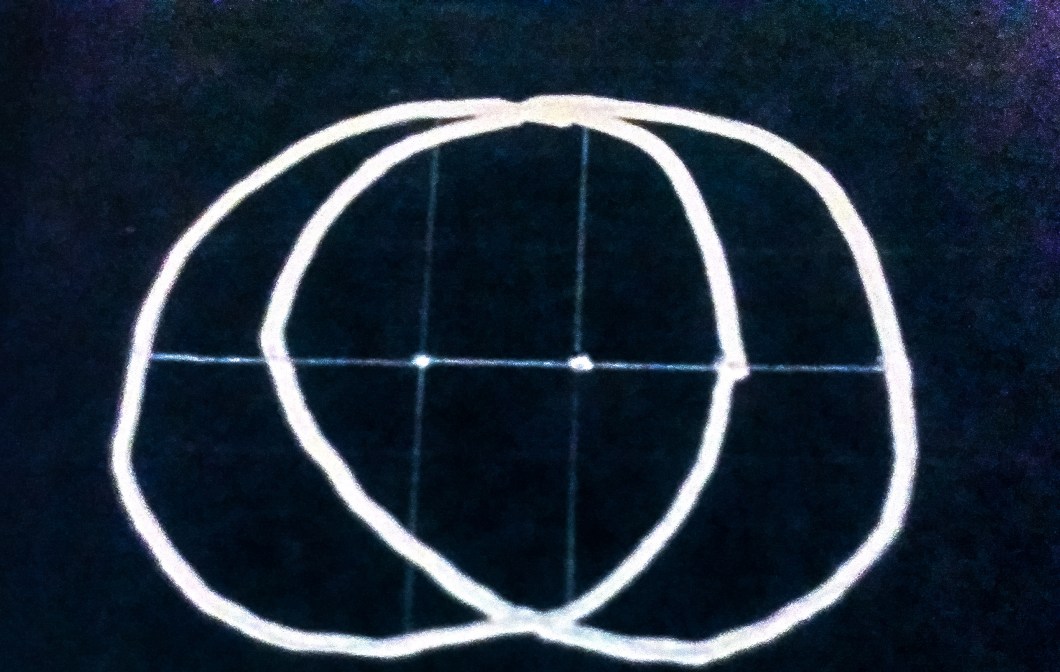
In the end, I put this equation into my calculator and got a= 1/2. This means that the ratio of the radius to the distance between the centers is 2.
The ratio between those two lengths for the Venn diagram at the top is closer to one, which means that the middle section has been underrepresented. Mathematicians must fix this problem and ensure that each part of the Venn diagram will be proportionately represented. This is what a Venn diagram should look like.
